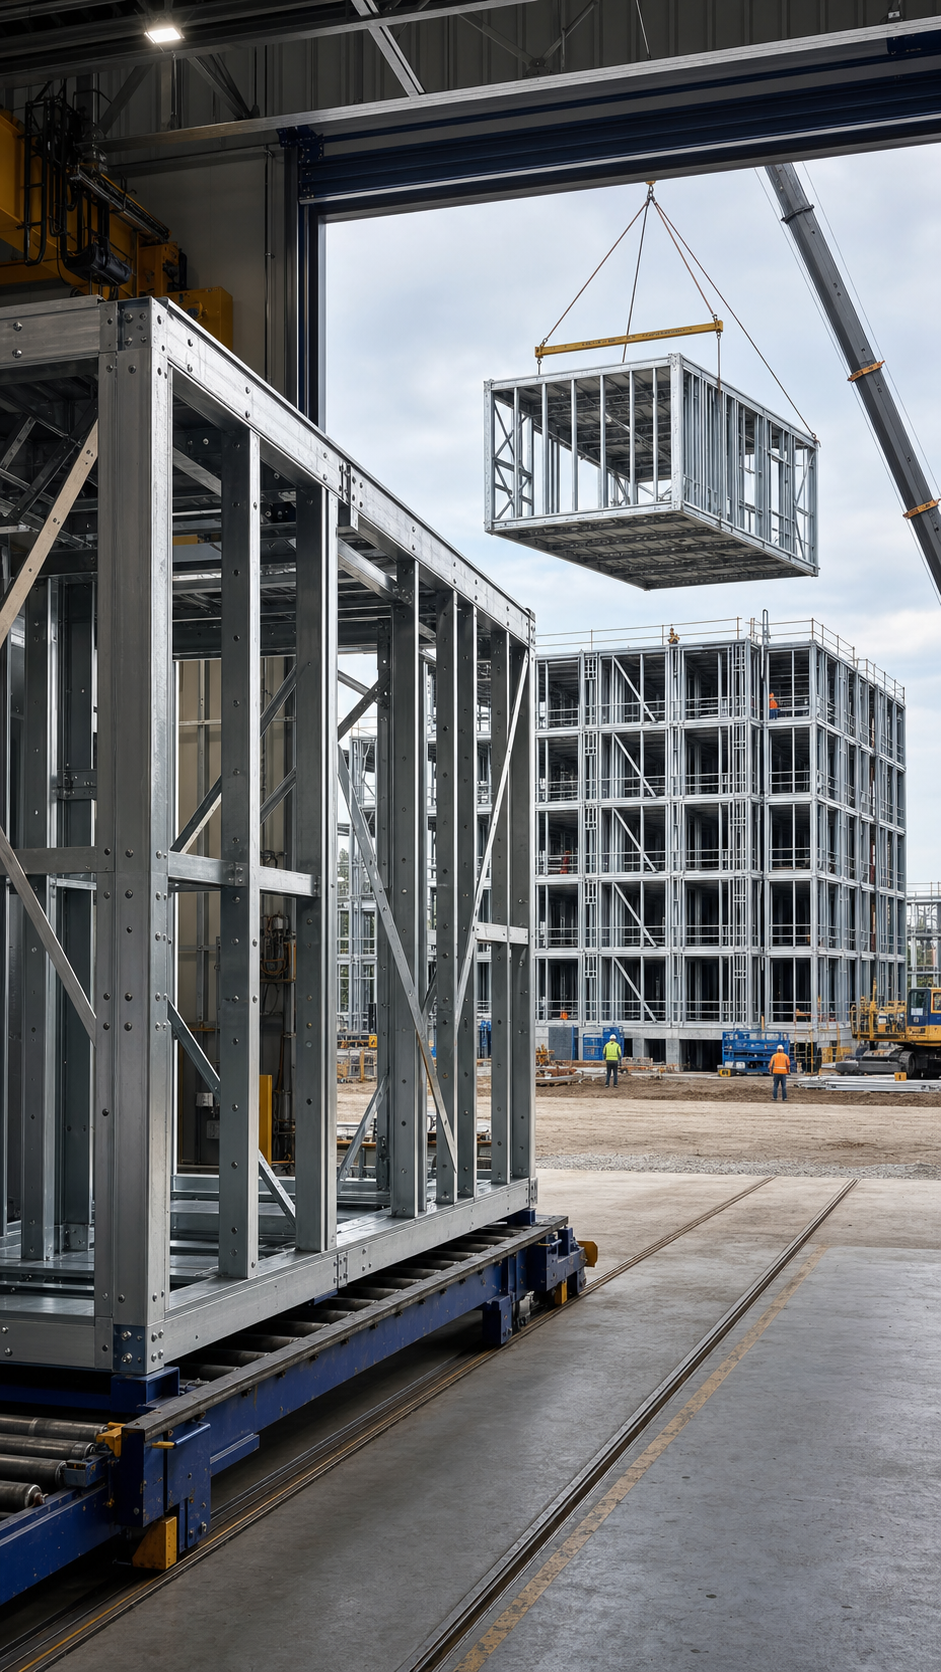
The claim that 2025–2027 represents a decisive window for prefabricated construction adoption in the United States rests on three structural forces: a persistent labor shortage, a housing deficit measured in millions of units, and evidence that factory-built methods can reduce schedule risk — under the right conditions. None of these guarantees that prefab will capture the moment. But together they create a testable adoption thesis that developers, lenders, and public owners can evaluate against project-specific evidence.
The Labor Constraint Is Real and Structural
The Associated Builders and Contractors estimated in January 2026 that the U.S. construction industry would need to attract approximately 349,000 net new workers in 2026 and 456,000 in 2027. The Associated General Contractors of America reported in August 2025 that 92% of construction firms that were hiring had difficulty filling open positions, and 45% said worker shortages were directly causing project delays.
The Housing Deficit Adds Demand Pressure
The U.S. housing shortage estimates vary by methodology. The Congressional Research Service noted in 2025 that Up for Growth reported a shortfall of 3.78 million units. The U.S. Chamber of Commerce and the American Society of Civil Engineers cite a deficit of 4.5–4.7 million homes. These use different baselines and geographies, but they converge on the same conclusion: existing supply cannot meet demand. Factory production can draw on a manufacturing labor pool and reduce site-trade requirements per unit.
What the Market Data Actually Shows
The Modular Building Institute's 2026 report, developed with FMI Consulting, estimated the U.S. permanent modular construction market at $20.5 billion in 2025 — approximately 5.1% of construction activity in selected addressable segments. MBI forecasts 6.5% compound annual growth through 2030; if achieved, the market would reach roughly $28.1 billion. The report also names continuing barriers: financing gaps, permitting inconsistency, uneven pipelines, design coordination challenges, and limited modular experience among project teams. MBI reports factory production can reduce timelines by 20% to 50%, a range drawn from manufacturer input, not a controlled study.
2025 market estimate
of addressable segments
Forecast CAGR (2025–2030)
The Academic Evidence Is Small but Directional
Smith and Rice's 2015 study of 17 international permanent-modular case studies found an 11% average cost reduction and 42% schedule reduction. Limitations are significant: only 10 of 17 cases had substantial data; seven were comparable on schedule, eight on cost. Costs were normalized to first-quarter 2014 U.S. dollars and Washington, D.C. location. No large U.S.-only multicenter study exists in peer-reviewed literature.
Execution Implications
For a developer evaluating steel-framed modular delivery, the adoption thesis translates into six domains to verify on each project:
Financing and draw curves
Conventional loans release funds against visible site progress. Modular projects commit capital while work is inside the factory. MBI's June 2026 financing guidance advises separating factory and site costs, documenting production milestones, and establishing protections for off-site funds. A draw curve that front-loads the average outstanding balance can erase the interest benefit of a shorter schedule. The underwriting model should test the lender's actual milestone timing rather than assume a standard modular advance rate.
Labor and workforce
Factory production shifts work to manufacturing employees at different wage rates and recruitment channels. But the factory must have consistent backlog to retain workers. The developer should verify current headcount, shift structure, and training pipeline — not just stated annual capacity.
Procurement and design freeze
Modular front-loads design decisions: grids, MEP penetrations, fire assemblies, transport envelopes, and connections must be resolved before production. The schedule needs a binding design-freeze date with a clear consequence for missed deadlines.
Permitting and approvals
Texas Occupations Code Chapter 1202 governs industrialized housing, including design review, manufacturer registration, and inspection decals. But Section 1202.252 preserves municipal authority over zoning, foundations, utilities, fire access, and certificates of occupancy. The state review and local permit cycles rarely align automatically.
Factory capacity and utilization
This is the least documented risk. TerraCore's review did not identify a public, industry-wide benchmark for the percentage of stated North American factory capacity converted into completed modules. Stated capacity is a design specification, not an operating result. Developers should request trailing 12-month throughput, line utilization, first-pass yield, and on-time delivery.
Insurance and bonding
NFP identifies five distinct modular risks: transport damage, manufacturing defects, off-site coverage gaps, theft or vandalism during storage, and assembly errors. Builder's risk must explicitly cover off-site production, transit, and storage. Products-completed operations coverage is needed for post-turnover defects. Bonding for manufacturers is less standardized than for site contractors.
Limitations of the Thesis
The thesis does not account for several factors that could delay adoption. Interest rate increases penalize front-loaded modular draws more than conventional schedules. Tariffs on imported steel affect fabricated module costs. Adoption depends on local codes, factory proximity, and transport routes — a window open in Texas may not exist in the Northeast. Factory failures during this period could damage the model's reputation. And no study has tracked modular project performance across a large U.S. sample from design through warranty; lifecycle cost and long-term quality claims remain unsupported.
A Go/No-Go Test for Developers
- Can the manufacturer substantiate stated capacity? Reconcile trailing 12-month module completions, accepted units, line hours, shift structure, first-pass yield, and on-time delivery against the capacity claim.
- Do reconciled bids compare complete installed scope? Include modules, foundation, transport, crane, site finish, commissioning, contingency, taxes, escalation, and exclusions on the same basis as the conventional GC bid.
- Does the lender's draw schedule match the factory cash curve? Model payment timing, title transfer, collateral control, inspection evidence, retainage, and the developer's negative-carry exposure before modules reach the site.
- Is design freeze tied to procurement and production? Define the last responsible dates for structural, MEP, envelope, fire-life-safety, transport, and connection decisions, with signed change-control consequences.
- Does insurance follow the modules through every custody point? Confirm builder's risk or inland-marine coverage for factory work, storage, loading, transit, staging, setting, and completed operations.
- Does the critical path prove parallel flow? Quantify the overlap among foundations, utility work, factory production, transport readiness, setting, and closeout; do not count factory speed that merely moves the queue elsewhere.
- Do project-specific downside cases preserve an acceptable return? Set redlines for module-cost escalation, production delay, transport interruption, average loan balance, lease-up timing, and manufacturer default before committing.
Conclusion
The 2025–2027 window is a reasonable thesis supported by structural labor shortages, a multi-million-unit housing deficit, and an expanding but still-small evidence base. It is not a market certainty. Adoption will be captured — project by project — by teams that verify factory throughput, reconcile installed-cost bids, negotiate draw schedules, lock designs early, and price modular-specific insurance risks. For those who cannot meet these conditions, the window does not open yet, regardless of the calendar.